

AgentBaseTry Now
AgentBase
What is AgentBase?
AgentBase is Genspark's AI-powered business system builder — it turns one sentence into custom Dashboards, CRM, and business systems in minutes. Describe what you want to manage, and AI builds the database, fills in starter data, and generates a ready-to-use view. No spreadsheets, no schema design, no SQL required.
Standing up a business system traditionally means figuring out which tables you need, designing fields, entering data row by row, and manually configuring dashboards. AgentBase collapses all of that into one sentence → a working system, with no technical knowledge required.
Primary Use Cases
- CRM — customers, contacts, deals, follow-up notes
- Inventory & orders — products, stock levels, incoming/outgoing
- Content calendar — topics, status, platforms, schedule
- Recruiting pipeline — candidates, roles, interview stages, evaluations
- Personal trackers — reading notes, budgets, travel plans, goals
Who It's For
Anyone who needs to manage "a structured set of items" over the long term — sales teams, operations, HR/recruiting, marketers, small-business owners, and individuals — without wanting to learn a database tool.
Key Benefits
- One sentence → working system — tables, data, and views all AI-built
- Persistent and reusable — your workspace stays; keep adding data, switching views, and sharing over time
- No technical skill needed — fully conversational; you never touch schemas or query syntax
- Multi-source consolidation — pull data from files, email, apps, and databases into one place
- From insight to action — draft follow-ups, flag risks, trigger automated reports
Quick Start
No installation required. All you need is a signed-in Genspark account.
Quick Start — Your First System in Under 10 Minutes
- Navigate to the Genspark homepage and click the AgentBase icon.
- Choose your starting point:
| Option | When to Use |
|---|---|
| Just describe it | Start from a plain-language prompt — AI builds from scratch |
| From files | Upload CSV, Excel, PDF, or Word |
| From your inbox | Pull in Gmail or Outlook data |
| From another app | Connect HubSpot, Salesforce, or a database |
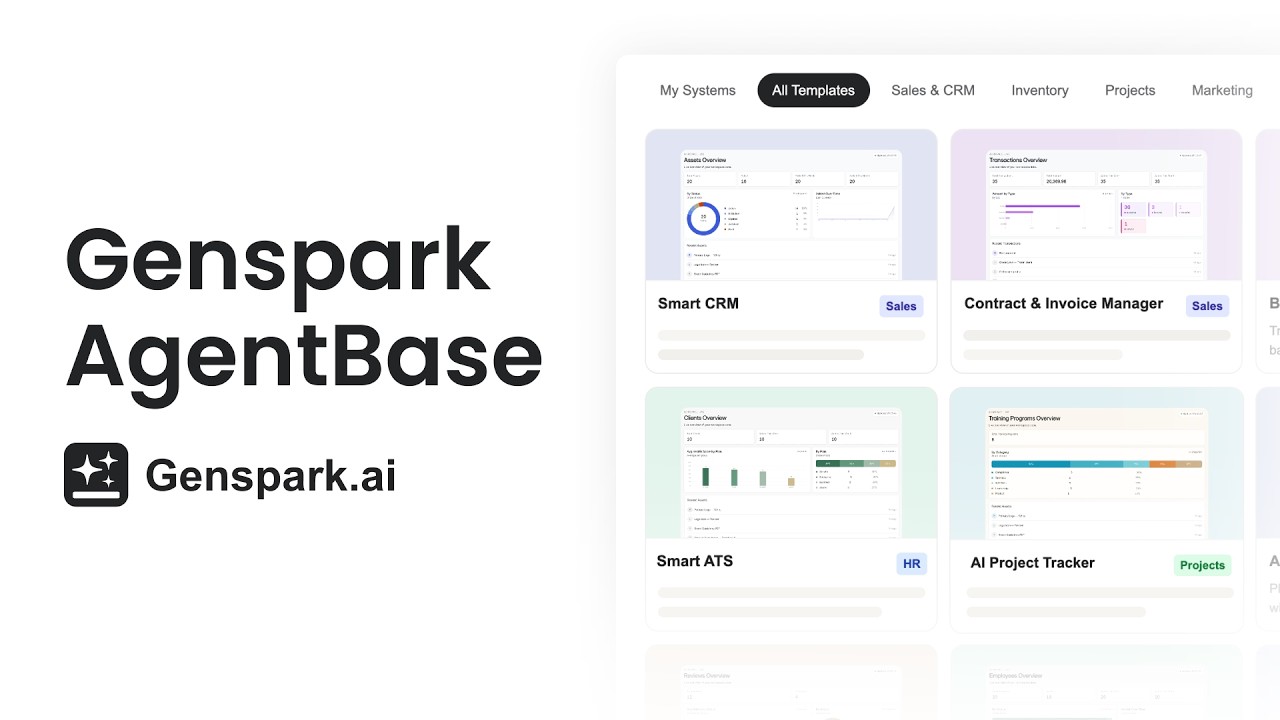
| Template Center | Browse by category tab → click a card → preview → Use this template |
- Describe what you want. Type one sentence in the input box, for example:
Help me manage customers and sales deals
Set up a recruiting pipeline to track candidates and interview stages
Create a vendor management system with contract renewal dates
- Verify your workspace. You'll know it worked when:
- The left sidebar shows Dashboards / Tables / Workflows groups
- The right pane shows your generated tables and a first view with starter data
- Your system appears under My Systems on the AgentBase homepage
From here, keep chatting to refine the structure, or move straight to importing your real data.
Core Concepts
The Three-Layer Model
Everything in AgentBase maps to three layers. Build them in this order:
Tables (data layer) → Views & Dashboards (presentation layer) → Workflows (automation layer)
Get the data right first, shape the views second, automate third.
Key Terms
| Term | Definition |
|---|---|
| Workspace / System | A persistent container for one business domain (e.g. "Sales CRM"). Holds all tables, views, dashboards, and workflows. |
| Table | A relational data table built by AI. Multiple tables can link to each other (e.g. "Customers" → "Deals"). |
| View | A way of presenting your table data — Table / Kanban / Gallery / Calendar / Form. Switching or deleting a view never changes the underlying data. |
| Dashboard | A summary page pulling KPI cards and charts from multiple tables, with clickable filters. |
| Workflow | A schedule-triggered automation that syncs data or sends reports in the background. |
| Starter data | Sample records AI seeds so you can see the structure immediately. Replaced when you enter real data. |
| Aggregated view | For very large datasets — AI imports summary results only (not every row) to keep performance fast. |
| Role | Access level on a shared workspace: Viewer / Editor / Owner. |
Foundational Rules
- Everything is conversational — describe intent; AI handles the technical work
- One system per conversation — to build or switch to another system, return to the homepage or start a new conversation
- Views are non-destructive — switching or deleting a view never touches the underlying data
- Persistence is the point — your system stays around for continuous use, unlike a one-off answer or spreadsheet
Feature & How-To Guides
Importing Your Data
All imports happen through chat — tell AI where your data is. No manual upload screens or connection wizards necessary.
| Source | How to Connect |
|---|---|
| Files | Upload Excel / CSV / PDF / Word, or a whole folder (Browse Local Files or Choose from AI Drive) |
| Gmail or Outlook — one-time authorization on first use | |
| Microsoft 365 | SharePoint, OneDrive, Teams, Outlook calendar & contacts |
| HubSpot | Paste a Private App Access Token (PAT) generated in HubSpot — this is not a one-click admin authorization |
| Salesforce & others | Follow the UI prompts for authorization |
| Databases | PostgreSQL, MySQL, Snowflake — provide connection info when prompted |
Large datasets: AI automatically builds an aggregated view for very large files — it imports summary results rather than every row to keep performance fast. Use filter prompts to work with subsets.
Views & Dashboards
Once your data is in, switch between views based on what you're trying to accomplish. Switch via the toolbar buttons (instant, always free) or ask AI in chat.
| View | Best For |
|---|---|
| Table | Full-field browse and bulk editing — your source of truth |
| Kanban | Process / stage tracking (deals, hiring pipeline, task triage) |
| Gallery | Image-heavy or card-based content (products, assets, profiles) |
| Calendar | Date-based data (renewals, content schedule, interview dates) |
| Form | Quickly adding new records via a shareable intake form |
| Dashboard | KPIs, totals, trend charts, and risk highlights across multiple tables |
How to build a dashboard: Describe what you want to track in chat, for example:
Create a dashboard showing total contract value by vendor, renewals in the next 90 days, and any accounts flagged as at-risk
AI generates KPI cards and charts. Click any chart element to filter the underlying table. Viewing a finished dashboard is always free.
Querying Your Data
No SQL or formula knowledge needed — ask in plain language and AI returns answers with cited cell references so you can verify the source.
Which records need action this week and why?
List products with stock below 10
Show accounts with no activity in the last 30 days
Workflows & Automation
Workflows let you automate recurring actions on a schedule — syncing data, sending reports, or flagging items that need attention.
To create a workflow:
- Once your views look correct, describe the automation in chat, for example: "Every Monday morning, compile last week's new deals into a summary and email it to me."
- AI builds the workflow with a schedule (Daily / Weekly / Monthly / Custom + timezone) and shows a Next Run At timestamp.
- Run a Test before enabling — AI simulates the trigger without firing real actions.
- Toggle the workflow On when you're satisfied with the output.
Best practice: Always set new communication workflows to draft-only first. Review the wording and trigger logic before enabling auto-send. Never auto-send to customers until you fully trust the output.
Sharing & Collaboration
Share your workspace, a single dashboard, or a single table with other people, and control what each person can do.
Choose what to share
When you open the Share dialog, you can set the scope of the share:
- Whole workspace — the person gets access to everything in the workspace (the original behavior, and still the default).
- A single dashboard — the person sees only that dashboard.
- A single table — the person sees only that table.
Sharing is controlled by who you invite and what role you give them — not by the URL. Everyone with an active invite sees the same scope you set, regardless of how the link is shared.
Invite people and assign a role
In the Share dialog, enter the person's email address, select a role, and click Invite. They'll receive an invitation and get access at the scope you set. Choose their level of access:
| Role | What they can do |
|---|---|
| Viewer | View data only |
| Editor | View and edit data |
| Owner | Full control, including managing sharing |
Troubleshooting
Common Problems & Solutions
| Problem | Solution |
|---|---|
| Report email never arrived | Connect Gmail/Outlook — the send step fails without a linked mailbox. Connect it and the workflow delivers on the next run. |
| Can't find a "Blank Workspace" card | There isn't one — use Just describe it or type directly into the composer. |
| No search box in Template Center | Browse via the left category tabs — there is no search box. |
| The table structure AI built isn't right | Tell AI in chat: "Add a column for X" / "Delete this table" / "Change what this field means." |
| Large dataset slowed or wasn't fully imported | AI builds an aggregated view automatically for large files — use filter prompts to work with subsets. |
| Workflow ran but nothing happened / errored | Check the run history for the error and confirm the mailbox is connected for email steps. Fix the existing workflow in place. Ask the agent to change it, or open the builder; edits apply to the same workflow object so run history and schedules survive. |
| Shared link shows "no access" | Check (1) active invite exists (2) invite covers the scope they're opening (3) signed in with the account the invite was sent to.. |
| Dashboard totals look wrong | Validate the source table first — check field mapping, date formats, and blank/null values before trusting dashboard output. |
| Fields mapped incorrectly after import | Use a follow-up prompt: "Rename 'Col A' to 'Account Name' and map the date column to 'Renewal Date'." |
FAQ
Do I need technical skills to use AgentBase?
- No. The entire experience is conversational — you never touch schemas, queries, or database configuration of any kind.
How is this different from AI Sheets?
- AI Sheets is a single table with calculations. AgentBase is a multi-table relational system with views, dashboards, workflow automation, and team sharing — built for managing a business category long-term, not just crunching numbers in one tab.
Will my system stay around?
- Yes. Every workspace is persistent and listed under My Systems on the homepage. Come back anytime to add data, switch views, or share.
Will scheduled workflows run if my computer is off?
- Yes — workflows run in Genspark's cloud, completely independent of your device.
Can I use this instead of Salesforce or HubSpot?
- Yes for core CRM use cases — pipeline tracking, account management, deal dashboards. It can also pull data from Salesforce or HubSpot to create a simplified view alongside other sources.
Is this only for sales teams?
- No. It works for any team managing structured data — HR pipelines, vendor contracts, project tracking, content calendars, onboarding checklists, and more.
Can multiple people use the same workspace at once?
- Yes. Invite teammates via the Share dialog and assign roles. Editors can update data and views; Viewers can browse and read reports.
Can I upload customer phone numbers and email addresses to AgentBase? Is it safe?
-
You may use AgentBase to store and manage customer contact data, such as phone numbers and email addresses, provided that your business has a lawful basis and all necessary rights or permissions to collect, use, and process that data.
-
Genspark applies security and access controls to stored data, including encryption and protections against using stored data to train generalized AI models.
If my business collects customer personal data, do I need separate consent for the cross-border transfer to Genspark?
-
This depends on the laws that apply to your business and the individuals whose data you collect. You are responsible for complying with applicable requirements for collecting, using, disclosing, and transferring personal data, including providing any required notice, obtaining consent where required, and using any required cross-border transfer mechanism.
-
A privacy-policy disclosure may be sufficient in some circumstances, but it does not automatically replace consent or other legally required safeguards. Businesses should consult qualified legal counsel if they are unsure what requirements apply.
-
Any content entered into AgentBase—including prompts, uploaded files, and customer data—is the business’s responsibility under the applicable Genspark terms and policies. See the Genspark Privacy Policy and Terms of Service.
Was this article helpful?