AI Infographic Generator, designed for data.
Drop in data, text, or a topic. Get a clean, on-brand infographic with stat callouts, icons, and a layout that actually fits the story.
How real teams use it
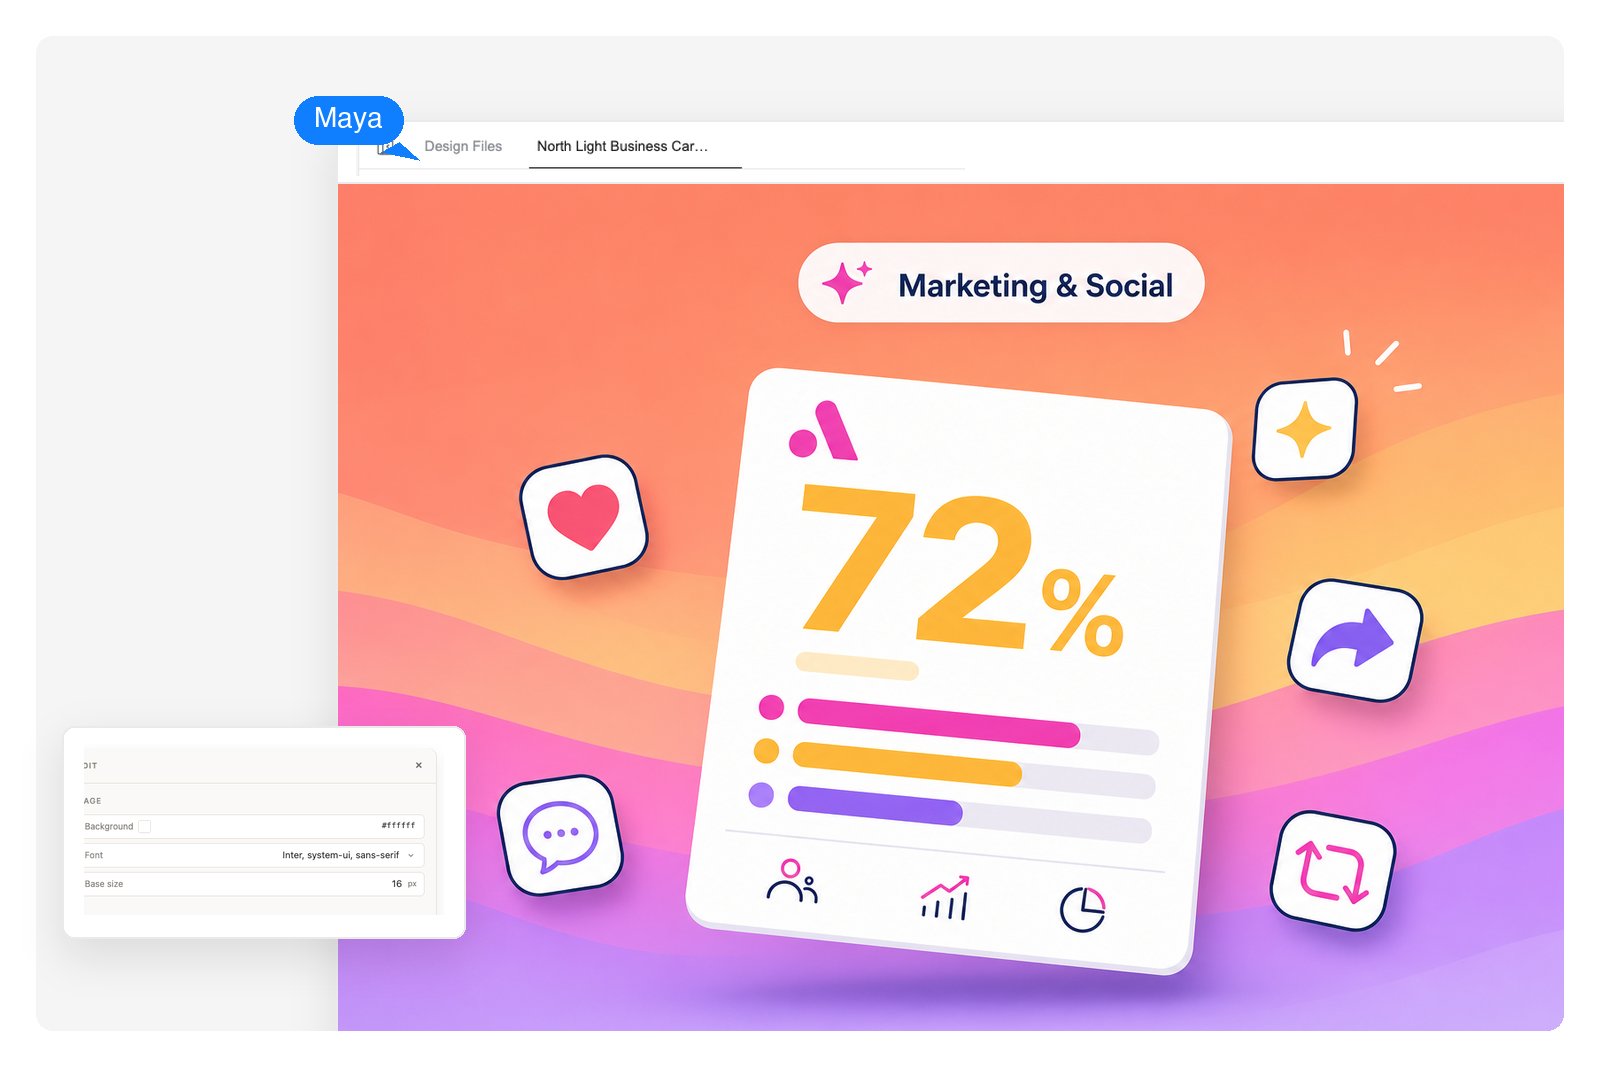
Marketing & social
Turn campaign data into scroll-stopping social tiles. Stat posts, brand-journey timelines, and comparison cards that earn shares without a design team.

Education & learning
Compress dense lecture material into visual study aids students actually look at. Concept explainers, science diagrams, and step-by-step process visuals.
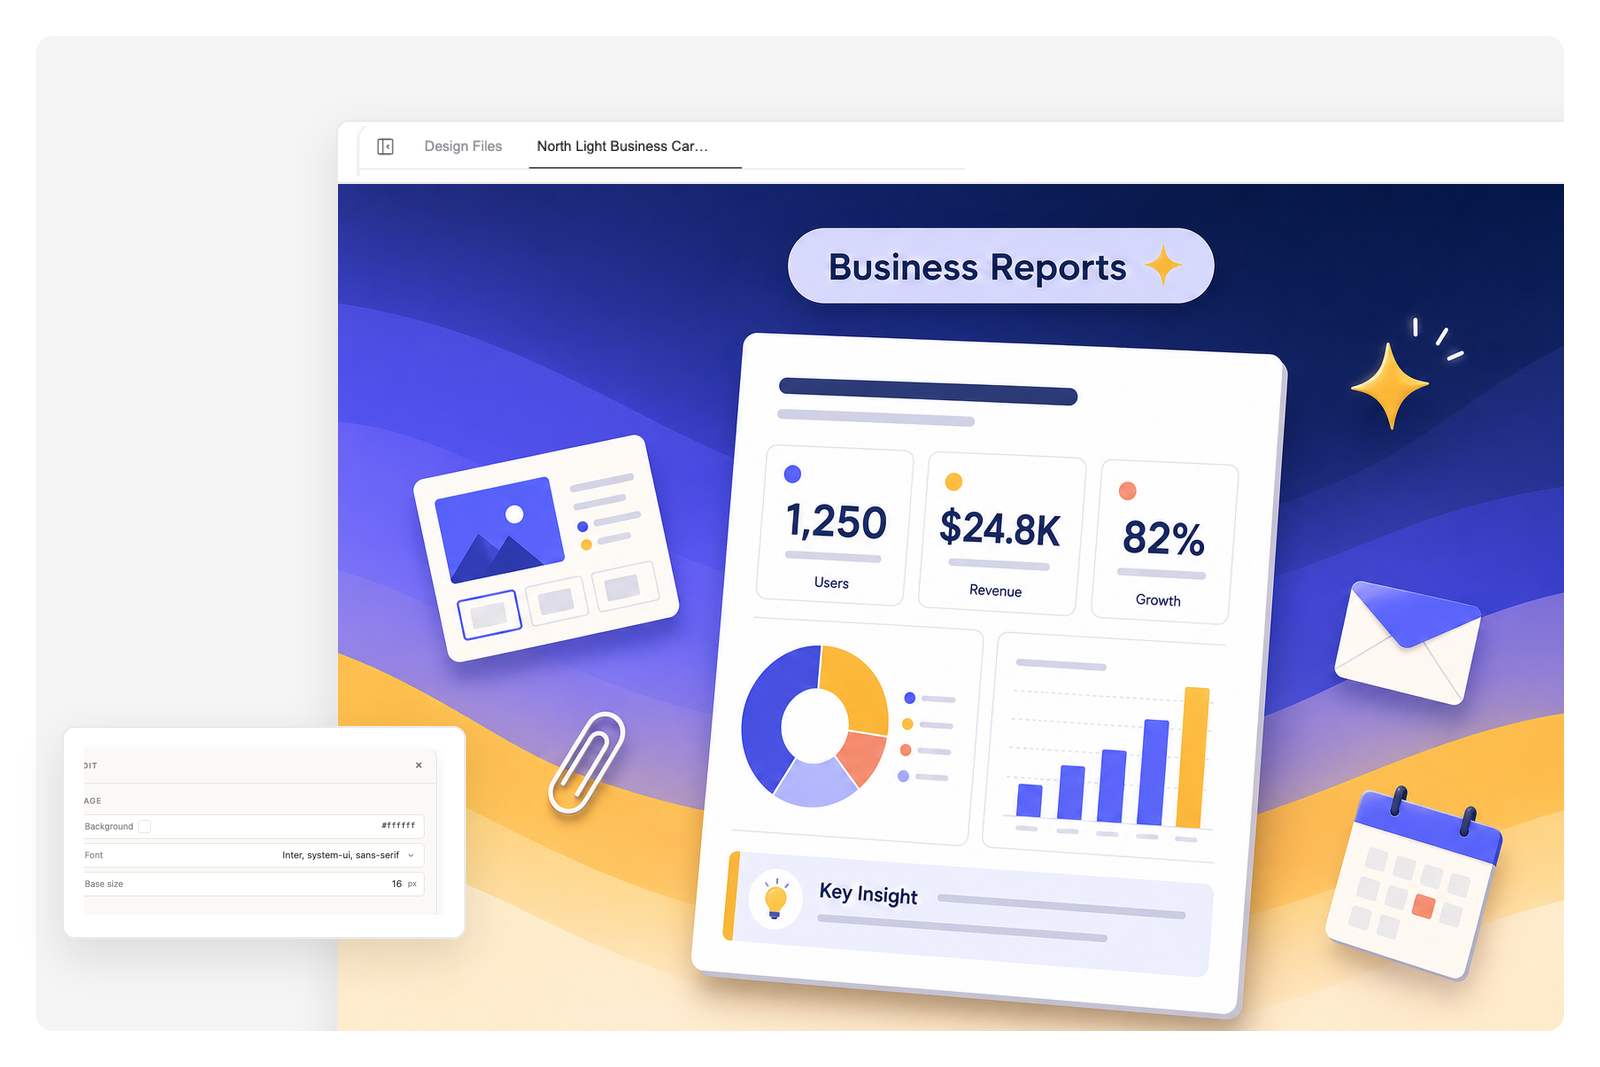
Business reports
Bury the wall of text. Pull the three numbers stakeholders need into a one-page visual summary they can paste into a deck or send before the meeting.
What makes ours different
Any style you can describe
Set the direction in the prompt — modern, corporate, playful, or technical — down to palette and mood. Same content, reskinned to match the brand or audience with one follow-up line.
Smart layout from text
Paste a paragraph, a list, or raw numbers. The AI picks the right structure — stat grid, process flow, comparison table, or timeline — and arranges everything to read at a glance.
Export-ready, still editable
The result is a fully editable design — adjust any element, then export as PDF or PPTX, or keep it in your deck. No design-file fiddling, no template wrangling.
Generate an infographic in 3 steps
Describe what to visualize
Type a topic, paste a paragraph, or drop in raw data. One short prompt is usually enough — the AI fills in the structure.
AI builds the infographic
It picks a layout, generates icons and chart callouts, and lays out the typography. You see a fully composed result, not a template waiting to be filled in.
Download or refine
Export it when it's ready, or follow up to swap the style, change the palette, rewrite a section, or regenerate any part of the design.
Frequently Asked Questions
What kind of inputs can I use?
A topic, a paragraph of text, a list, a paste of stats, or a brief outline. The AI structures whatever you give it into an infographic. Cleaner inputs lead to more predictable outputs.
Can it generate infographics from data?
Yes. Paste numbers, percentages, or a quick table and the AI converts them into stat callouts, bar charts, and comparison rows automatically. You don't need to format the data first.
What visual styles are available?
Set the visual direction in your prompt — modern, corporate, playful, or technical — along with the color palette, the aspect ratio, and whether to include icons. Change the style later with a follow-up, without rewriting the content.
What does the output look like?
An editable infographic page in the format you asked for — vertical for social, horizontal for decks, or square tiles. Keep refining it, drop it into a presentation, or export it as PDF or PPTX.
Can I edit the result after it's generated?
Yes. Follow-up prompts let you swap styles, recolor sections, rewrite copy, regenerate icons, or change the layout. The first output is a draft, not the final.
How is this different from a generic image generator?
A generic image generator gives you pixels. An infographic generator picks a structure, allocates space for stat callouts and charts, sequences icons by meaning, and renders typography that actually reads. The output is information design, not a stylized picture.
Is my data safe?
Inputs are processed in your private Genspark workspace and aren't used to train models. Generated images stay in your project history until you delete them.